Most software budgets get the math wrong. Teams plan carefully for the build, but then treat the years that follow as a rounding error. In fact, the software maintenance cost percentage of total ownership ranges from 50 to 80 percent. Naturally, the exact figure depends on industry, software type, and how your team built the system. So if you budget only for the launch, you have paid for a fraction of the true cost.
This guide breaks down the benchmarks. First, you will see what percentage of the total software cost goes to maintenance. Next, we look at how that percentage shifts by industry and software type, and how to calculate your own ratio. Finally, you will know whether your current spending is healthy or quietly signaling a much bigger problem.
Why the Maintenance Percentage Matters for Budgeting
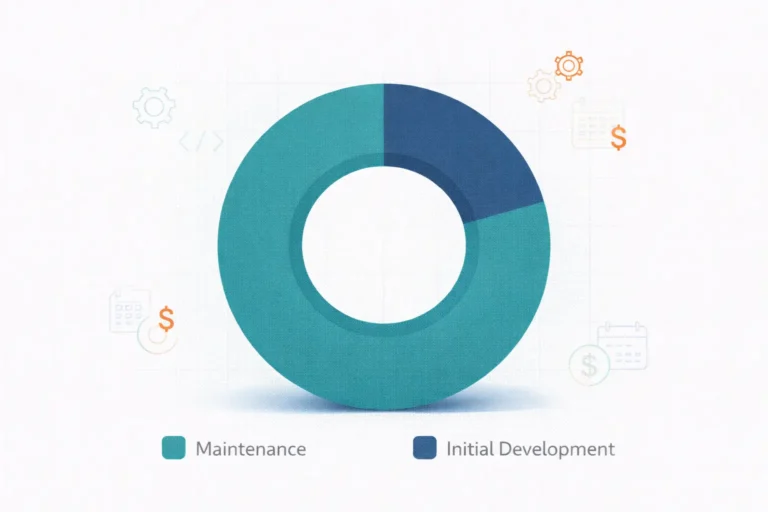
Total cost of ownership (TCO) for software has two halves. First, there is the initial build — design, development, testing, and launch. Second, there is everything afterward. Specifically, that includes bug fixes, security patches, dependency upgrades, new features, and infrastructure scaling. It also covers the steady drip of small changes that keep the system useful. In short, this second half is almost always the larger one.
Why does the percentage matter? Because budgets fail predictably when leaders treat maintenance as an afterthought. Either the software degrades because no one funded upkeep, or the maintenance bill arrives unannounced. As a result, it forces difficult tradeoffs against new initiatives. Clearly, knowing the realistic percentage in advance lets you plan the full lifecycle, not just the launch.
The Headline Number: 50–80 Percent of Total Software Ownership
Across decades of research, the consensus range is consistent. For example, Gartner reports that organizations spend 55 to 80 percent of their IT budgets on maintaining existing systems. Consequently, that leaves a much smaller share for building new ones. Similarly, the IEEE Computer Society puts the maintenance share at 60 to 80 percent of total software lifecycle cost. Likewise, similar numbers appear in the annual project database of the International Software Benchmarking Standards Group (ISBSG).
The range is wide for good reason. Specifically, cost depends on how your team built the software, what it integrates with, and how often the platform changes. Furthermore, it depends on how much risk the business carries if the software fails. For instance, a simple internal tool might sit at the lower end. By contrast, a regulated financial system with constant compliance demands sits firmly at the upper end.
Breakdown by Software Type
Not all software ages at the same rate. Naturally, the maintenance percentage varies with the system’s complexity. In addition, it varies with the degree to which the system couples to other moving parts.
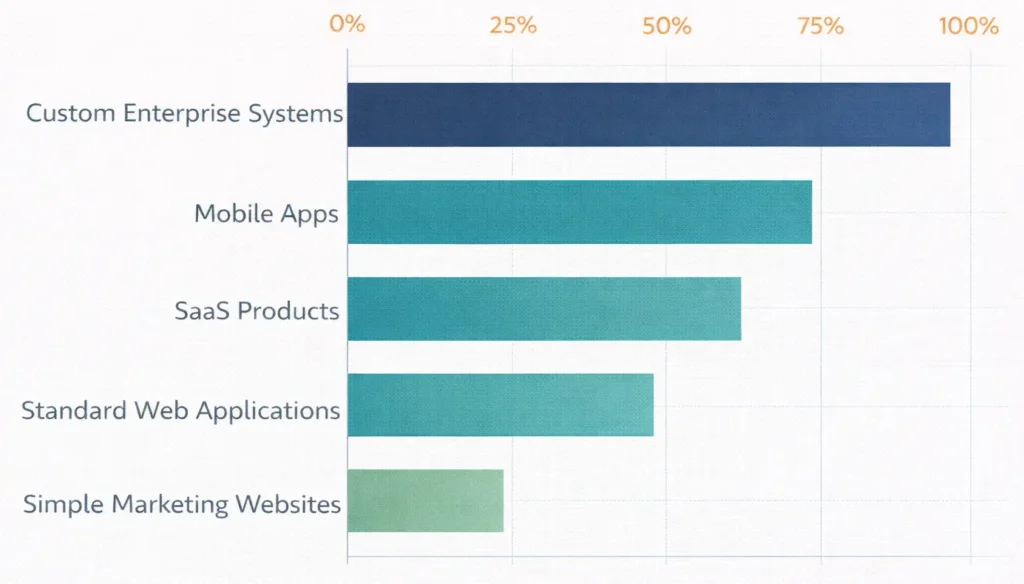
- Custom enterprise systems (60–80%): Complex business logic, integrations with multiple internal tools, and continuous regulatory or operational changes. The maintenance burden compounds over the years.
- Mobile apps (45–70%): Two operating systems with annual major releases, device fragmentation, and store policy changes that force code updates whether the business wants them or not.
- SaaS products (40–60%): Continuous deployment, multi-tenant scaling, and the need to ship new features just to stay competitive. Lower than enterprise because the codebase is more consolidated.
- Standard web applications (30–50%): Lighter integration surface, but still subject to security patches, framework upgrades, and browser compatibility shifts.
- Simple marketing websites (20–40%): Mostly content updates, plugin and CMS upgrades, and occasional redesigns. The lowest maintenance share, but never zero.
If your project sits well outside its expected range, that is a signal. In short, either the team underbuilt the system and now patches it constantly, or technical debt has started to compound.
Breakdown by Industry
Industry shapes the maintenance percentage almost as much as the software type does. In particular, sectors with heavy regulation, high uptime expectations, or rapid platform evolution sit at the top.
- Healthcare (65–80%): HIPAA, regional health data laws, frequent integrations with EMR systems, and zero tolerance for data loss drive the high percentage.
- Financial services (70–80%): Compliance audits, real-time transaction monitoring, and ongoing fraud-prevention updates make it the most maintenance-heavy industry.
- Government and public sector (60–75%): Long system lifespans, accessibility requirements, and procurement cycles that delay modernization keep maintenance high.
- Retail and e-commerce (50–65%): Seasonal traffic spikes, payment integration updates, and constant catalog evolution.
- Logistics and supply chain (50–65%): Multiple third-party APIs, customs and tariff changes, and edge-case operational logic accumulate over time.
- SaaS and digital products (40–60%): Lower than regulated industries, but balanced by the constant pressure to release new features.
Regulated industries pay more not because the code is harder, but because the cost of doing nothing is higher. Indeed, a missed compliance update can trigger fines that dwarf the entire maintenance budget.
The Four Maintenance Categories
Lientz and Swanson’s classic framework still describes how teams actually spend maintenance time. Notably, the percentages have held remarkably stable across decades of research, even as the technology has changed.
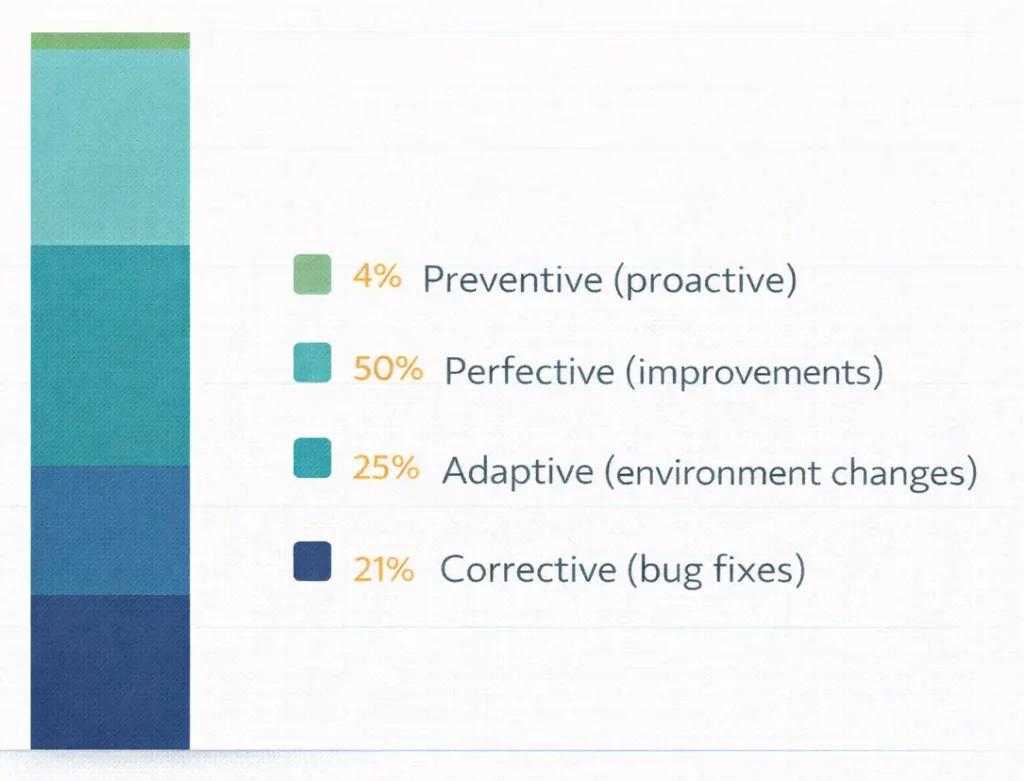
- Perfective maintenance (~50%): Improvements that are not strictly bug fixes — performance tuning, refactoring, usability enhancements, new minor features: the biggest slice, and the most strategically valuable.
- Adaptive maintenance (~25%): Keeping the software working as the environment changes — operating system upgrades, framework updates, new payment regulations, API deprecations.
- Corrective maintenance (~21%): Fixing defects discovered after release. The classic “bug fix” work that most stakeholders mentally equate with maintenance overall.
- Preventive maintenance (~4%): Proactive work to prevent future problems — refactoring fragile code, upgrading dependencies before they break, hardening security. The smallest slice, and the most chronically underfunded.
If corrective work dominates your team’s mix, the system is in firefighting mode. By contrast, healthy long-running products spend more on preventive and perfective work than on emergency fixes.
How to Calculate Your Own Software Maintenance Percentage
The formula is simple. However, the hard part is being honest about what counts.
Maintenance Percentage = Annual Maintenance Spend ÷ (Initial Build Cost + Cumulative Maintenance Spend) × 100
For a worked example, suppose a custom platform costs $300,000 to build. It has run for four years at $80,000 per year in maintenance. Therefore, total spend so far is $300,000 + ($80,000 × 4) = $620,000. Thus, the maintenance share is $320,000 ÷ $620,000 = 51.6 percent. Clearly, the system is approaching the typical maintenance-heavy phase. Moreover, that percentage will continue to climb as additional years of upkeep reduce the build cost.
Be sure your annual maintenance figure includes everything. Specifically, count developer time on bug fixes and small features, infrastructure and hosting, and third-party tool subscriptions. In addition, add security audits and the share of internal team time spent supporting the product. Otherwise, excluding hidden costs makes the percentage look artificially low. Consequently, you will be under budget for the next year.
What Counts as Healthy Versus Alarming
In its first three years, a system normally shows a maintenance share of 30 to 50 percent of cumulative cost. However, by year five, that figure typically reaches 60 to 75 percent. Naturally, the build cost stops growing while maintenance continues. Therefore, a high percentage on its own is not necessarily a problem — aging software naturally trends that way.
Three patterns should genuinely concern you. First, annual maintenance spending is rising faster than the business is growing — that signals accumulating technical debt. Second, corrective work dominates your maintenance mix — meaning your team is firefighting instead of improving the product. Third, maintenance spend that exceeds 25 percent of the original build cost every single year. Consequently, at that rate, you are rebuilding the system every four years through patches.
Conversely, suspiciously low maintenance percentages are also a warning. In fact, they usually mean the team is neglecting the software, not that it runs exceptionally well. Eventually, neglected systems deliver their bill all at once. Specifically, the bill arrives as a security incident or a forced rebuild.
How to Bring the Percentage Down
Reducing the maintenance share is rarely about cutting the maintenance budget. On the contrary, it is about making each maintenance dollar produce more output. Specifically, three levers work well over time. First, invest in automated testing. Second, address technical debt deliberately in each sprint. Finally, shift the mix away from corrective work toward preventive and perfective work.
Want the strategies that actually work? For example, see our companion guide on maximizing software maintenance ROI. Specifically, it covers AI-assisted monitoring, preventive maintenance schedules, and the build choices that pay off years later. Does your burden look more like accumulated technical debt? In that case, our technical debt guide for CTOs walks through where to start.
How Pegotec Helps
We work with clients across Cambodia and the wider region to bring their maintenance percentage back into a healthy range. First, that starts with a clear picture of where the money is actually going. Specifically, is it corrective firefighting, adaptive churn, or perfective improvements? Then we build a maintenance plan that fits the system’s current life stage.
Has your system drifted into the alarming range? In that case, our AI-enhanced maintenance services use automated monitoring and predictive checks to catch issues early. Similarly, for systems your team is still designing, we help build with maintenance economics in mind from day one.
Want an honest read on whether your current maintenance spend is healthy? Then contact Pegotec for a no-obligation consultation. First, we will help you understand the numbers behind your software. Furthermore, you will see what those numbers mean for the next three to five years.
Conclusion
Overall, the software maintenance cost percentage is one of the most useful yet often ignored metrics in software budgeting. In fact, across industries and software types, maintenance reliably consumes 50 to 80 percent of total ownership cost. Naturally, the right number for your specific system depends on what you built and who uses it. Furthermore, it depends on how the surrounding environment changes.
First, calculate your own ratio. Then compare it against the benchmarks in this guide. Finally, look at the mix: is your team firefighting, or actually improving the product? In short, the answer will tell you whether your current spending is sustainable. Conversely, it will tell you that the bill for years of underinvestment is about to come due.
Frequently Asked Questions
Software maintenance typically accounts for 50 to 80 percent of total software ownership cost over the system’s lifetime. However, the exact figure varies by industry and software type. For example, regulated industries such as finance and healthcare are at the upper end (70–80%). By contrast, simple marketing websites sit at the lower end (20–40%). Naturally, the longer a system runs, the higher the maintenance share becomes. Specifically, the initial build cost stops growing while upkeep continues.
Maintenance is expensive because the environment around software never stops changing. For example, operating systems release major versions annually, and frameworks deprecate APIs. Furthermore, regulations evolve, dependencies have security vulnerabilities, and user expectations shift. Consequently, each of these forces code updates whether the business asked for them or not. In addition, the largest share of maintenance time goes to perfective work. Specifically, these small improvements keep the product useful. In short, that is a steady ongoing investment rather than a one-time fix.
Take a mature system that has been running for five or more years. In that case, a maintenance share of around 70-80 percent of the cumulative cost is normal. Naturally, the built investment becomes a smaller fraction over time. However, for a brand-new system in its first two years, 80 percent maintenance is a red flag. Specifically, it usually signals either underbuilding or scope expansion. For instance, underbuilding means the system needs constant patching. By contrast, scope expansion means work that should have been part of the initial build.
Three levers move the needle the most. First, invest in automated testing within your CI/CD pipeline. Indeed, industry data shows this cuts ongoing maintenance costs by 30–50%. Second, allocate roughly 15 percent of each sprint to deliberately addressing technical debt. Finally, shift the maintenance mix from corrective firefighting toward preventive work. However, cutting the maintenance budget directly rarely works. In fact, it just defers the cost into a larger emergency later.
A useful starting point is 15 to 25 percent of the original build cost per year for ongoing maintenance. For example, a $200,000 build should expect roughly $30,000 to $50,000 per year in maintenance spend. Naturally, regulated industries and complex enterprise systems sit at the upper end of that range. However, is your annual maintenance consistently above 25 percent of the build cost? In that case, the system likely needs the deliberate reduction of technical debt rather than continued patching.
Let's Talk About Your Project
Enjoyed reading about Software Maintenance Cost Percentage: 2026 Industry Benchmarks? Book a free 30-minute call with our consultants to discuss your project. No obligation.